Portfolio Overview
As at 31 December 2024 (excluding Figtree Grove Shopping Centre)
| Properties Valuation | 4.0 billion |
| Lettable Area | NLA: 914,557 sq ft in SG / GLA: 1,485,977 sq ft in Aus |
| Occupancy Rate | 97.5% |
| Number of Tenants | 727 |
| Footfall | 54.9 million |
Portfolio Occupancy
| As at 31 December 2023 | As at 31 December 2024 | |
|---|---|---|
| SINGAPORE | ||
| Paragon | 100.0% | 99.5% |
| The Clementi Mall | 100.0% | 100.0% |
| Singapore assets | 100.0% | 99.6% |
| AUSTRALIA | ||
| Westfield Marion | 97.0% | 96.2% |
| Australia Assets | 97.0% | 96.2% |
Portfolio Lease Expiry as at 31 December 2024 (Excluding Figtree Grove Shopping Centre)
| FY2024 | FY2025 | FY2026 | FY2027 | FY2028 | FY2029 and beyond | |
|---|---|---|---|---|---|---|
| Singapore | ||||||
| By NLA | 0% | 12% | 33% | 33% | 15% | 7% |
| By Gross Rental income | 0% | 12% | 26% | 34% | 13% | 15% |
| Westfield Marion | ||||||
| By GLA | 3% | 7% | 6% | 6% | 6% | 72% |
| By Gross Rental Income | 7% | 17% | 12% | 10% | 11% | 43% |
| Portfolio Total | ||||||
| By NLA/GLA | 2% | 9% | 17% | 16% | 10% | 46% |
| By Gross Rental Income | 1% | 13% | 24% | 29% | 13% | 20% |
Top 10 Tenants as at 31 December 2024
PARAGON REIT's portfolio top 10 tenants contributed 22.8% of gross rental income for the month of December 2024. The top 10 tenants by gross rental income are listed below.
| Tenant | Trade Sector | Lease Expiry (Year) | % of total GRI |
|---|---|---|---|
| Tenant A | Luxury brands, jewellery, watches | Between 1H2025 & 2H2029 | 4.7% |
| Tenant B | Department Stores & Supermarket | 1H2027 | 3.2% |
| Tenant C | Luxury brands, jewellery, watches | 2H2027 | 3.0% |
| Tenant D | Department Stores & Supermarket, General retail | Between 1H2025 & 2H2031 | 2.1% |
| Tenant E | Luxury brands, jewellery, watches | Between 1H2027 & 2H2029 | 1.9% |
| Tenant F | Luxury brands, jewellery, watches | 1H2029 | 1.8% |
| Tenant G | Department Stores & Supermarket, Lifestyle | Between 1H2025 & 2H2027 | 1.8% |
| Tenant H | Luxury brands, jewellery, watches | 1H2027 | 1.7% |
| Tenant I | Medical Suites / Offices | Between 1H2025 & 2H2027 | 1.3% |
| Tenant J | Luxury brands, jewellery, watches | Between 1H2025 & 2H2027 | 1.2% |
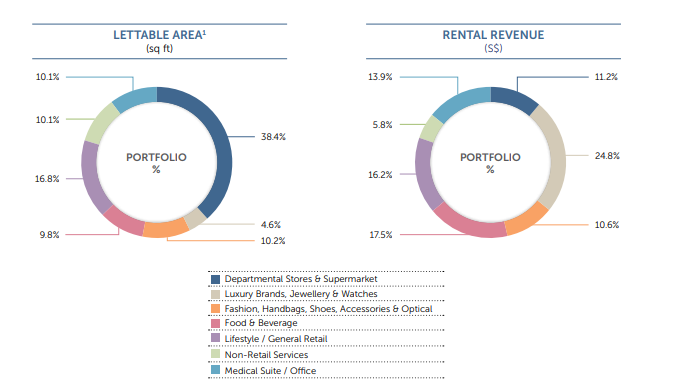
By Trade Mix